


All Courses
Digital Marketing
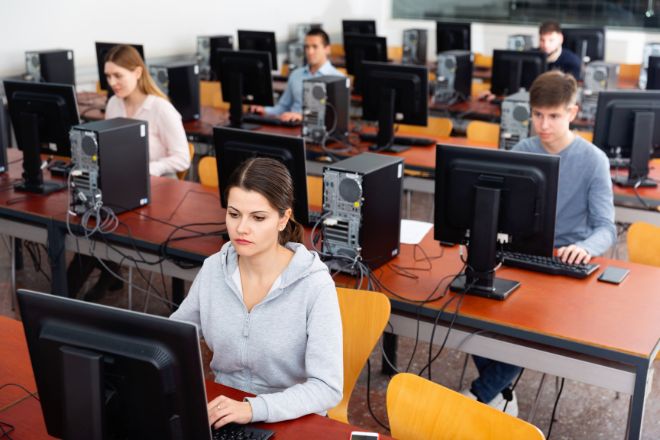
Computer Courses
Coding Classes
Data Analytics
Graphic Design & Video
All Courses
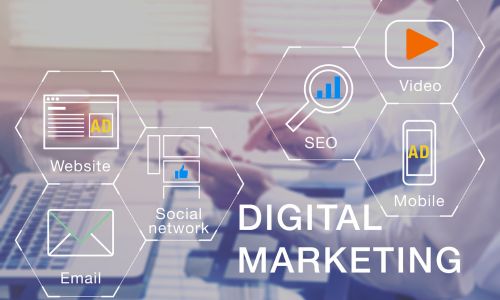


Digital Marketing
Computer Courses
Coding Classes
Data Analytics
Graphic Design & Video
Iqbal sir is a fantastic teacher for digital marketing and web design. Working with him was enriching, and I learned a lot about digital marketing. What's even better is his readiness to assist even after class. Thank you, Iqbal Sir. For a reliable computer institute in Haryana, I highly recommend tapping into Iqbal's expertise.
Abdullah 
Best web training institution in Haryana, thanks to Iqbal Sir's clear teaching and real-life examples in digital marketing. Grateful for his guidance. For a reliable computer institute in Haryana, consider Iqbal Sir's expertise.
Sara Khan 
Samantus Web Training: great teachers, especially Iqbal Sir, a digital marketing expert. Before, I knew nothing about digital marketing or web design. Now, thanks to him and the institute, I can build and market websites. Grateful to Iqbal Sir for my digital marketing success. Samantus Web Training: top computer institute in Haryana.
Vinod Kumar 
Discovered Samantus Web Training while searching for a digital marketing course in Haryana. It's the top choice for both digital marketing and web design training at a computer institute in Haryana. Now, an expert in both fields, thanks to Samantus. I am grateful for the opportunity provided by this institute.
Rehman Ali 
I'm pleased to share that I've recently completed the Digital Marketing Course at Samantus Web Training Institute and achieved success. I express my sincere gratitude for the valuable learning experience. Thank you!"It is the best computer institute in haryana.
Rekha Bhatia